At the customer I’m currently working for I’m part of this team assigned with creating and implementing a organization wide Agile training and coaching program in support of their bigger organization change which includes a broad agile way of working. Exciting stuff, lots of pitfalls for sure, a source for interesting discussions, learning a lot and above all a whole lot of fun. What we as a team ran into during our work was the need for a tool to coach the different teams in a way to let them discover themselves how mature they were with the agile implementation and what they should focus on next.
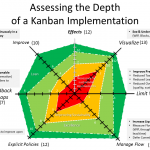
 I remembered David Anderson presenting a radar chart as a way to plot the maturity of a Kanban implementation during the Kanban coaching masterclass I attended. Trying to re-discover some of that I ended up at Christophe Achouiantz website where he describes his approach for using the radar chart as a coaching tool – very cool and some really awesome other stuff on his website as well btw. I was already very enthusiastic about the radar chart approach the first time I heard it, Christophe provided some great hints and tips to add to that.
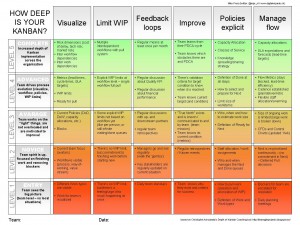
This same past week a colleague of mine and myself ended up at an Agile Holland meeting where we got talking with a consultant describing his visualization tool for the maturity of a scrum team. It turned out he used the somewhat same technique Xebia used within this organization for visualizing DevOps maturity which is matrix approach/presentation that somehow seems to resonate within the organization a lot better then the radar chart I liked so much 🙂
Anyways – we decided we’re gonna put together an Agile maturity matrix specific for this organization to help the teams measure their progress and plan their goals and as an fun exercise I started to transform David’s and Christophe’s radar charts to a Kanban Maturity Matrix.  Nothing to fancy – and I wholeheartedly believe that everyone should fill, edit, tweak and tune this to their own specific situation. I think this matrix view is a very powerful way of visualizing and representing a maturity level to a team you’re working with.
For full jpg click the image and the powerpoint (incl. empty matrix) is available here for download – feel free to grab, customize and enhance. It would be great if you would let me know if you do!

